Visualization
Dashboard
To explore the final summary tables obtained from the different submodules and generate publication ready figures, a user interface can be accessed :
Option1 : Singularity image
wget https://github.com/Darcy220606/AMPcombi-interface/releases/download/v2.0.0/ampcombi_interface.sif

singularity run ampcombi_interface.sif
Option2 : Through CLI for backend custom editing
git clone https://github.com/paleobiotechnology/AMPcombi.git
cd AMPcombi

conda create -n ampcombi_gui python=3.13 -y
conda activate ampcombi_gui
pip install -r ./pyshiny/requirements.txt

python -m shiny run --port 37231 --reload --autoreload-port 36257 ./pyshiny/app.py
💡 After rendering the app, feel free to upload the test file in the interface. The test file can be found in
./pyshiny/tests/Ampcombi_summery_cluster.tsv.Note
The updated app files can be found here.
To work with the interface, all AMPcombi submodules must have been run, including clustering of AMPs and prediction of signaling peptides. Additionally, for the taxonomy tab of the interface, it has to be made sure the column
mmseqs_lineage_contigis provided. It contains the lineage format obtained from running MMseqs2 taxonomy module, which can also be generated by the AMP and taxonomy workflows of nf-core/funcscan.
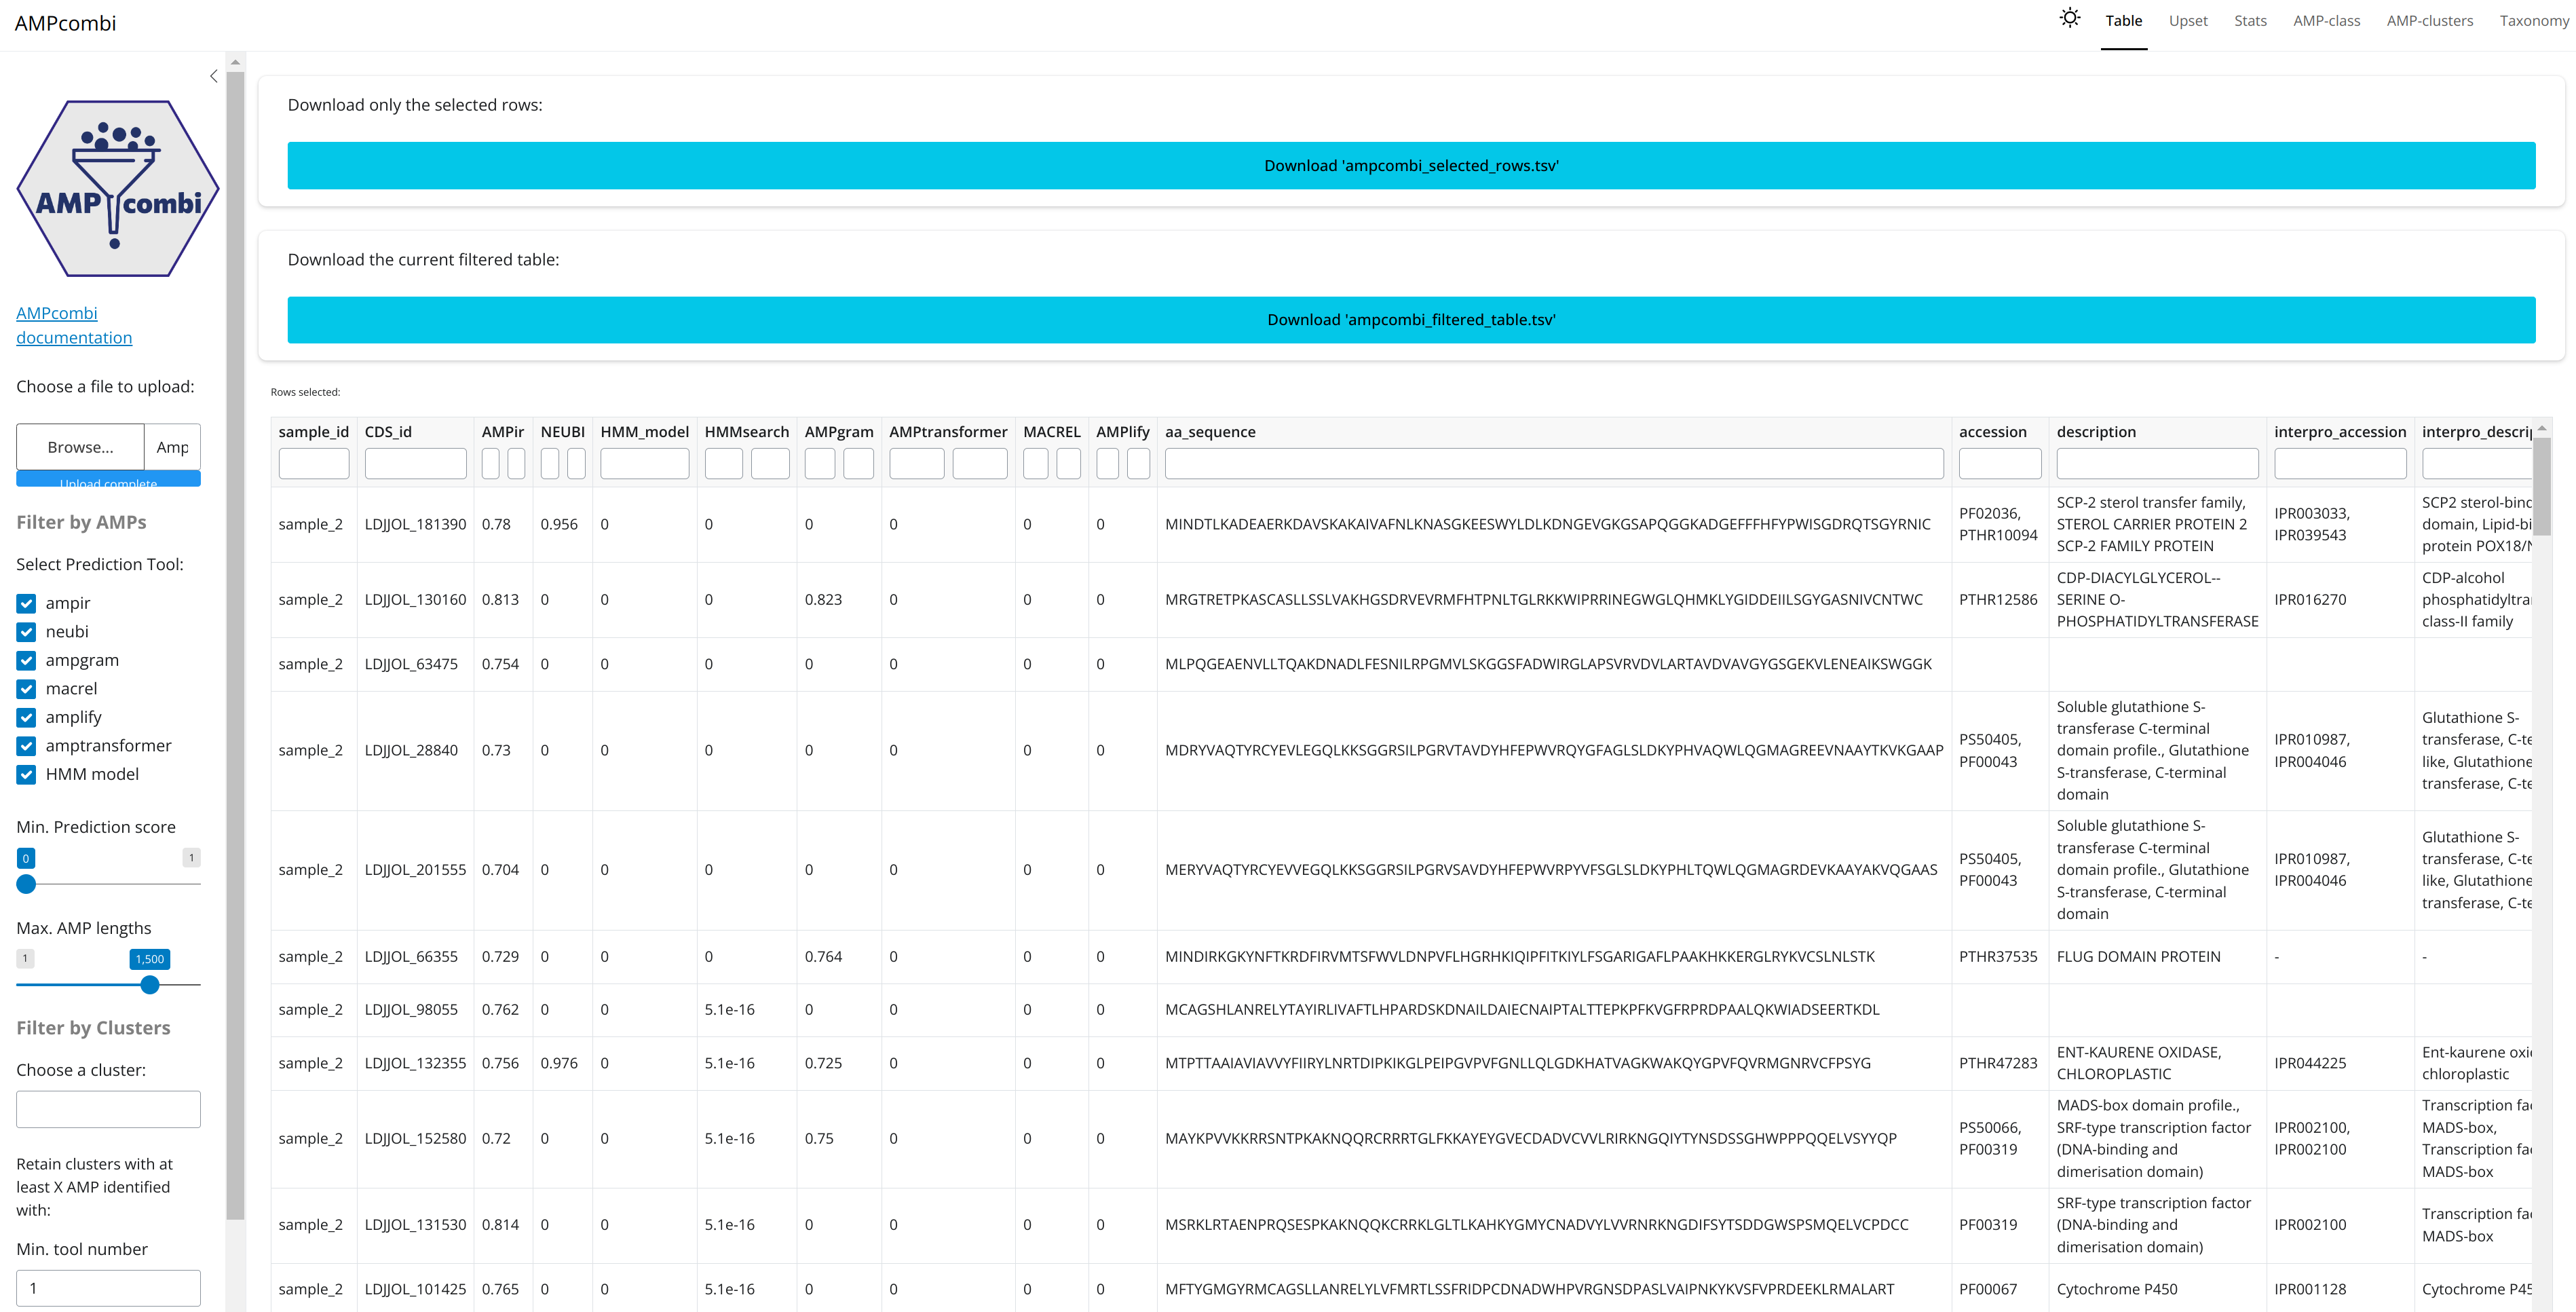
Example table:
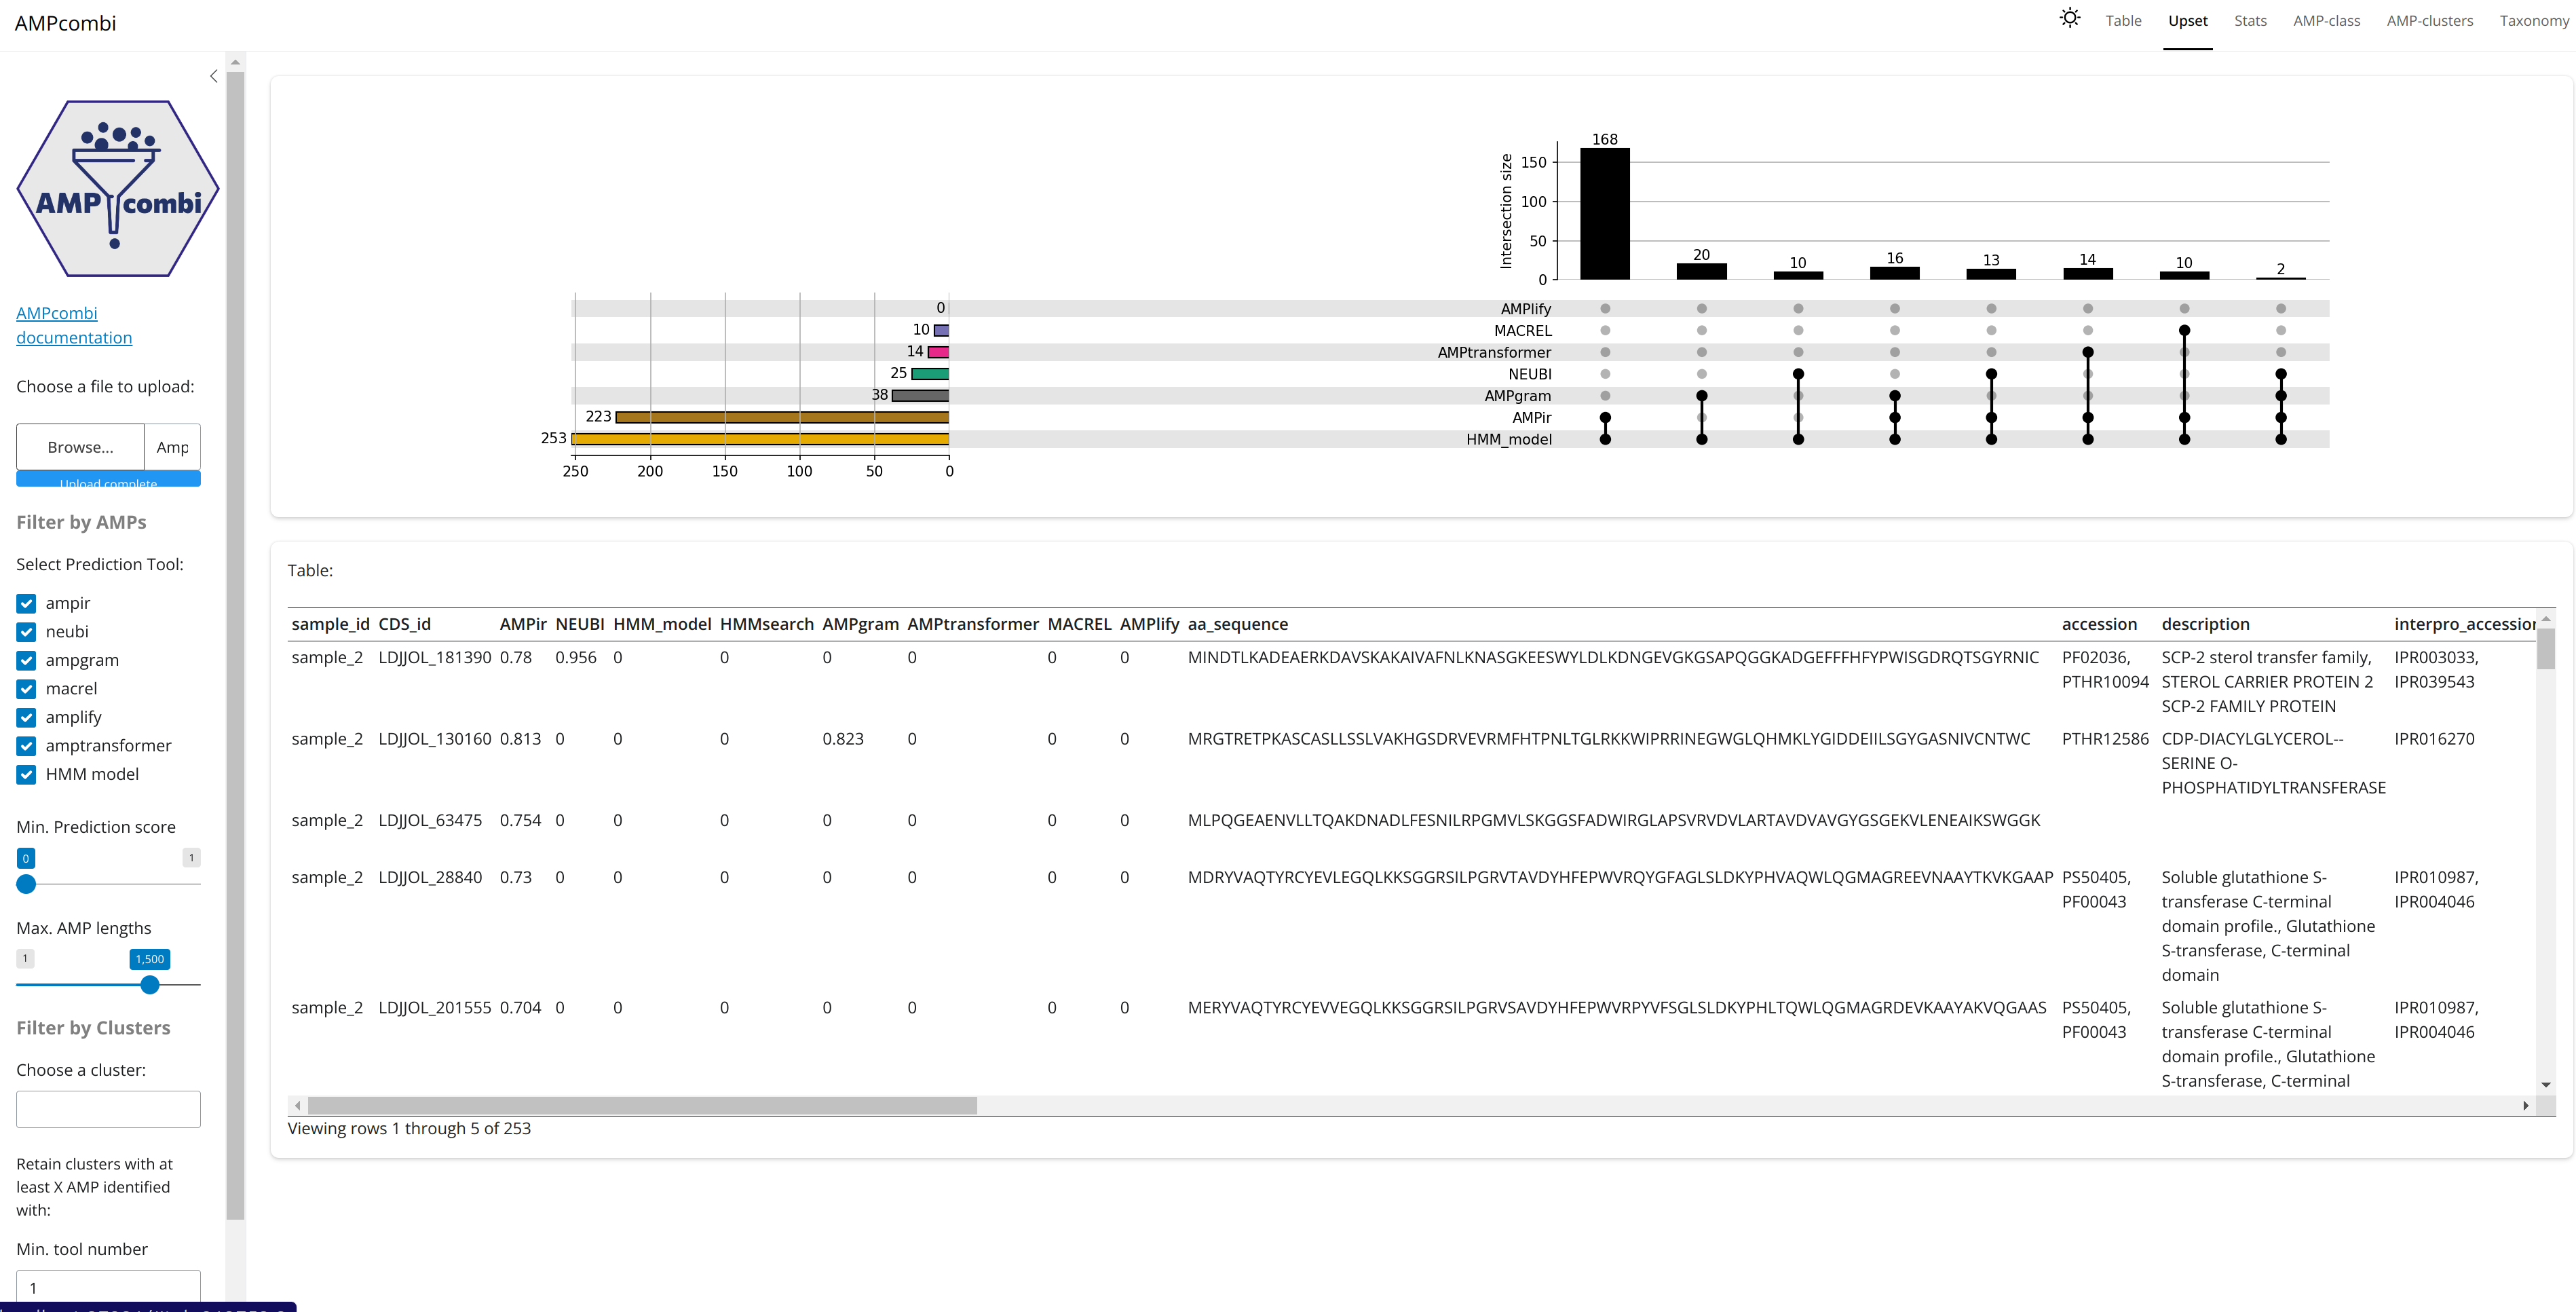
Example upset plot: